GLWD v2 technical details
Overview
The Global Lakes and Wetlands Database (GLWD) version 2.0 is a harmonized global database providing detailed and updated mapping of 33 distinct classes of wetlands, including lakes, rivers, and other natural and artificial wetlands such as marshes, swamps, and peatlands. The wetland coverage is presented at a grid cell resolution of approximately 500 meters (15 arc-seconds) yet offers sub-pixel information from original sources down to 10 meter resolution. It builds upon the original version of GLWD by integrating new satellite and ground-based datasets, ensuring improved spatial and thematic consistency across the globe. The database covers a total global wetland area of approximately 18.2 million km², representing about 13.4% of the global land area excluding Antarctica.
Originally developed by Lehner and Döll in 2004, the first iteration of GLWD has become a foundational reference for diverse environmental applications over the decades. It has supported research and decision-making in areas such as water resource management, climate change impact assessments, biodiversity conservation, and ecosystem services evaluation. GLWD v2 continues this legacy, serving as a critical reference for applications including hydrological and ecological modeling, biodiversity assessments, conservation planning, and studies on greenhouse gas emissions and human-environmental health.
Distribution of global wetlands
The global distribution of wetlands in GLWD v2 shows clear regional contrasts shaped by both natural conditions and anthropogenic influences, including wetland loss and transformation in many temperate and tropical zones.
Asia contains the largest share of wetlands, accounting for nearly 44% of their global extent, driven by extensive river systems, tropical wetlands, and widespread rice agriculture. North and Central America follow, with a combined 27%, due in part to vast peatlands in Canada and the U.S., as well as floodplains and marshes. Europe and South America also contribute sizable wetland areas, including boreal peatlands and tropical floodplains like the Pantanal and Amazon basin. Africa and Oceania host fewer wetlands proportionally, but still include ecologically significant systems such as the Sudd, Okavango, and coastal mangroves. Wetlands are densest in tropical and boreal zones, particularly in areas with seasonal flooding or persistent saturation, while drier or mountainous regions show far lower coverage.

Total wetland extent from the Global Lakes and Wetlands Database (GLWD) v2, showing the combined percent coverage of all wetland classes per 500 m grid cell. Values range from 1% to 100%; cells with 0% coverage are classified as dryland.
Dominant Wetland class
The global map of dominant wetland classes in GLWD v2 reveals distinct geographic patterns shaped by climate, topography, and land use. Peatlands dominate in northern latitudes, particularly across Canada, Russia, and parts of northern Europe, where cold, wet conditions support thick organic soils. These northern peatlands are often forested in boreal zones and more open in tundra regions.
Tropical and subtropical regions, especially in Southeast Asia and parts of the Amazon and Congo basins, show large expanses of seasonally flooded riverine wetlands. Paddy rice fields emerge as a dominant class in densely populated agricultural zones of South and East Asia.
Coastal wetlands, including mangroves and saltmarshes, fringe the tropical shorelines of Southeast Asia, West Africa, and Central America. Lakes dominate across the landscapes of Canada and other formerly glaciated areas, while large lakes are found in areas like the African Rift Valley, parts of North America, or the Baltic region.

Dominant wetland class assigned to each 500 m grid cell in the Global Lakes and Wetlands Database (GLWD) v2. Wetland extent per cell ranges from 1% to 100%; cells with 0% are classified as dryland. Legend includes class names with corresponding numerical codes in parentheses.
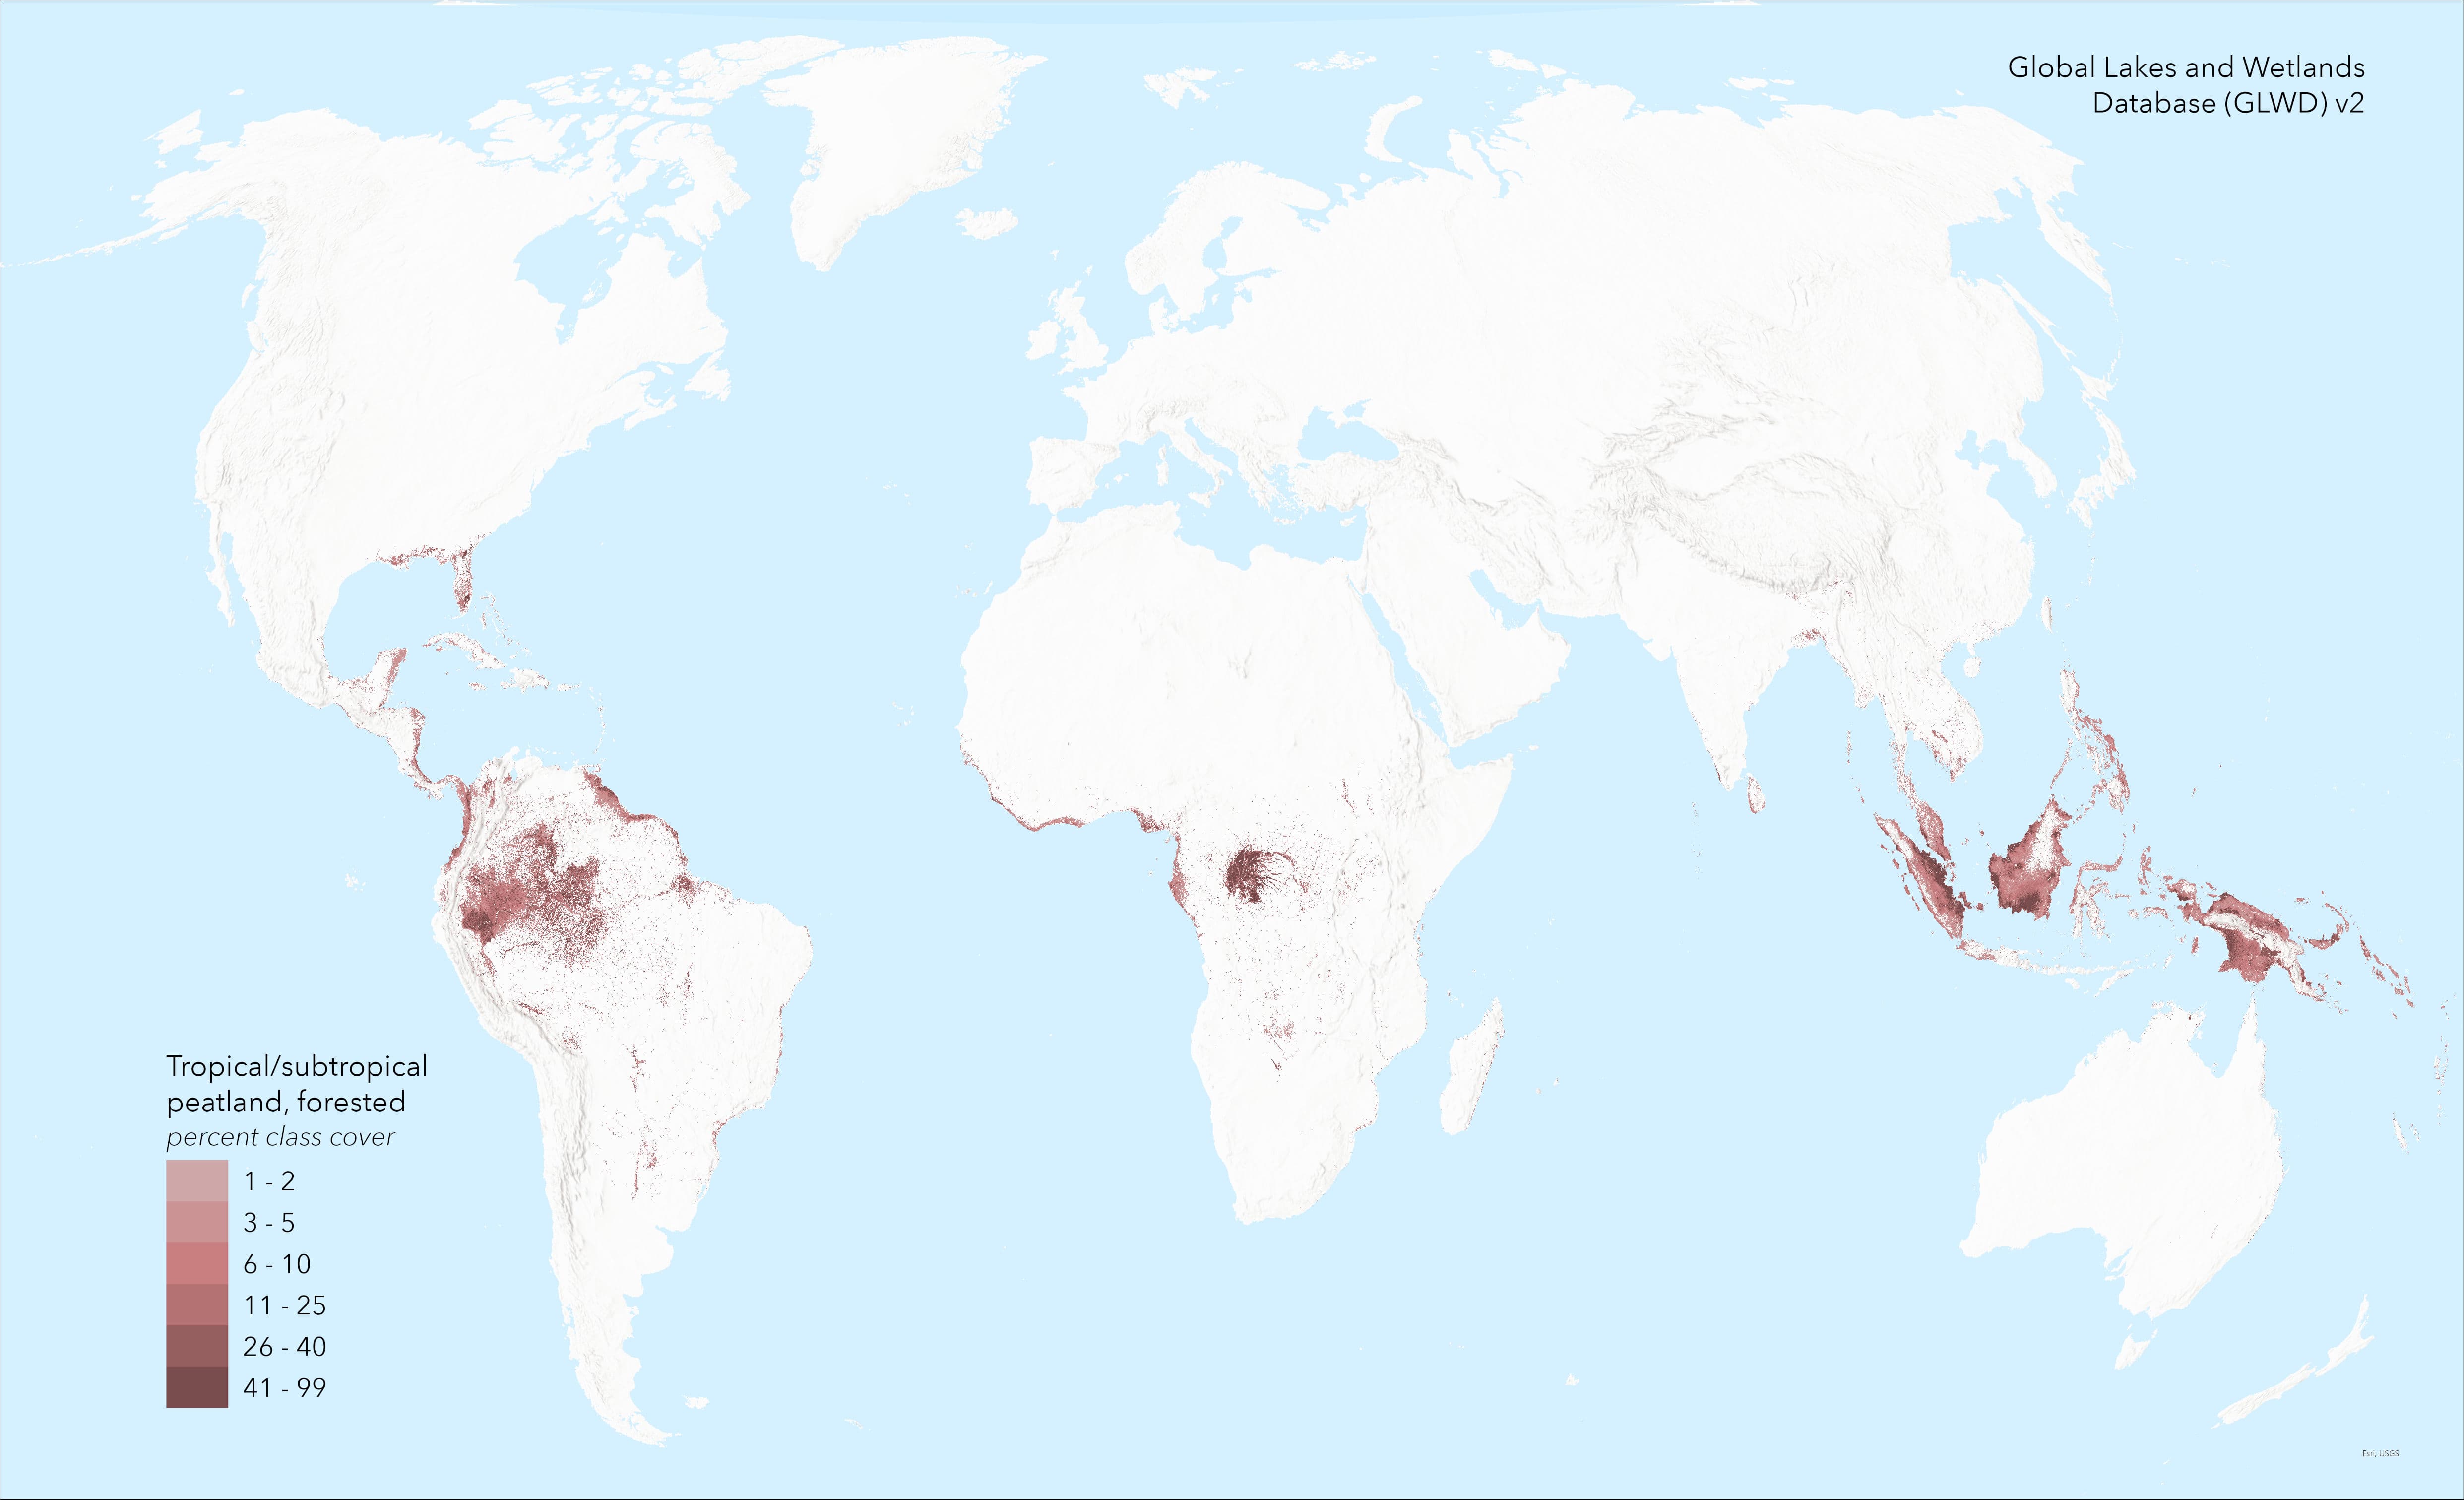
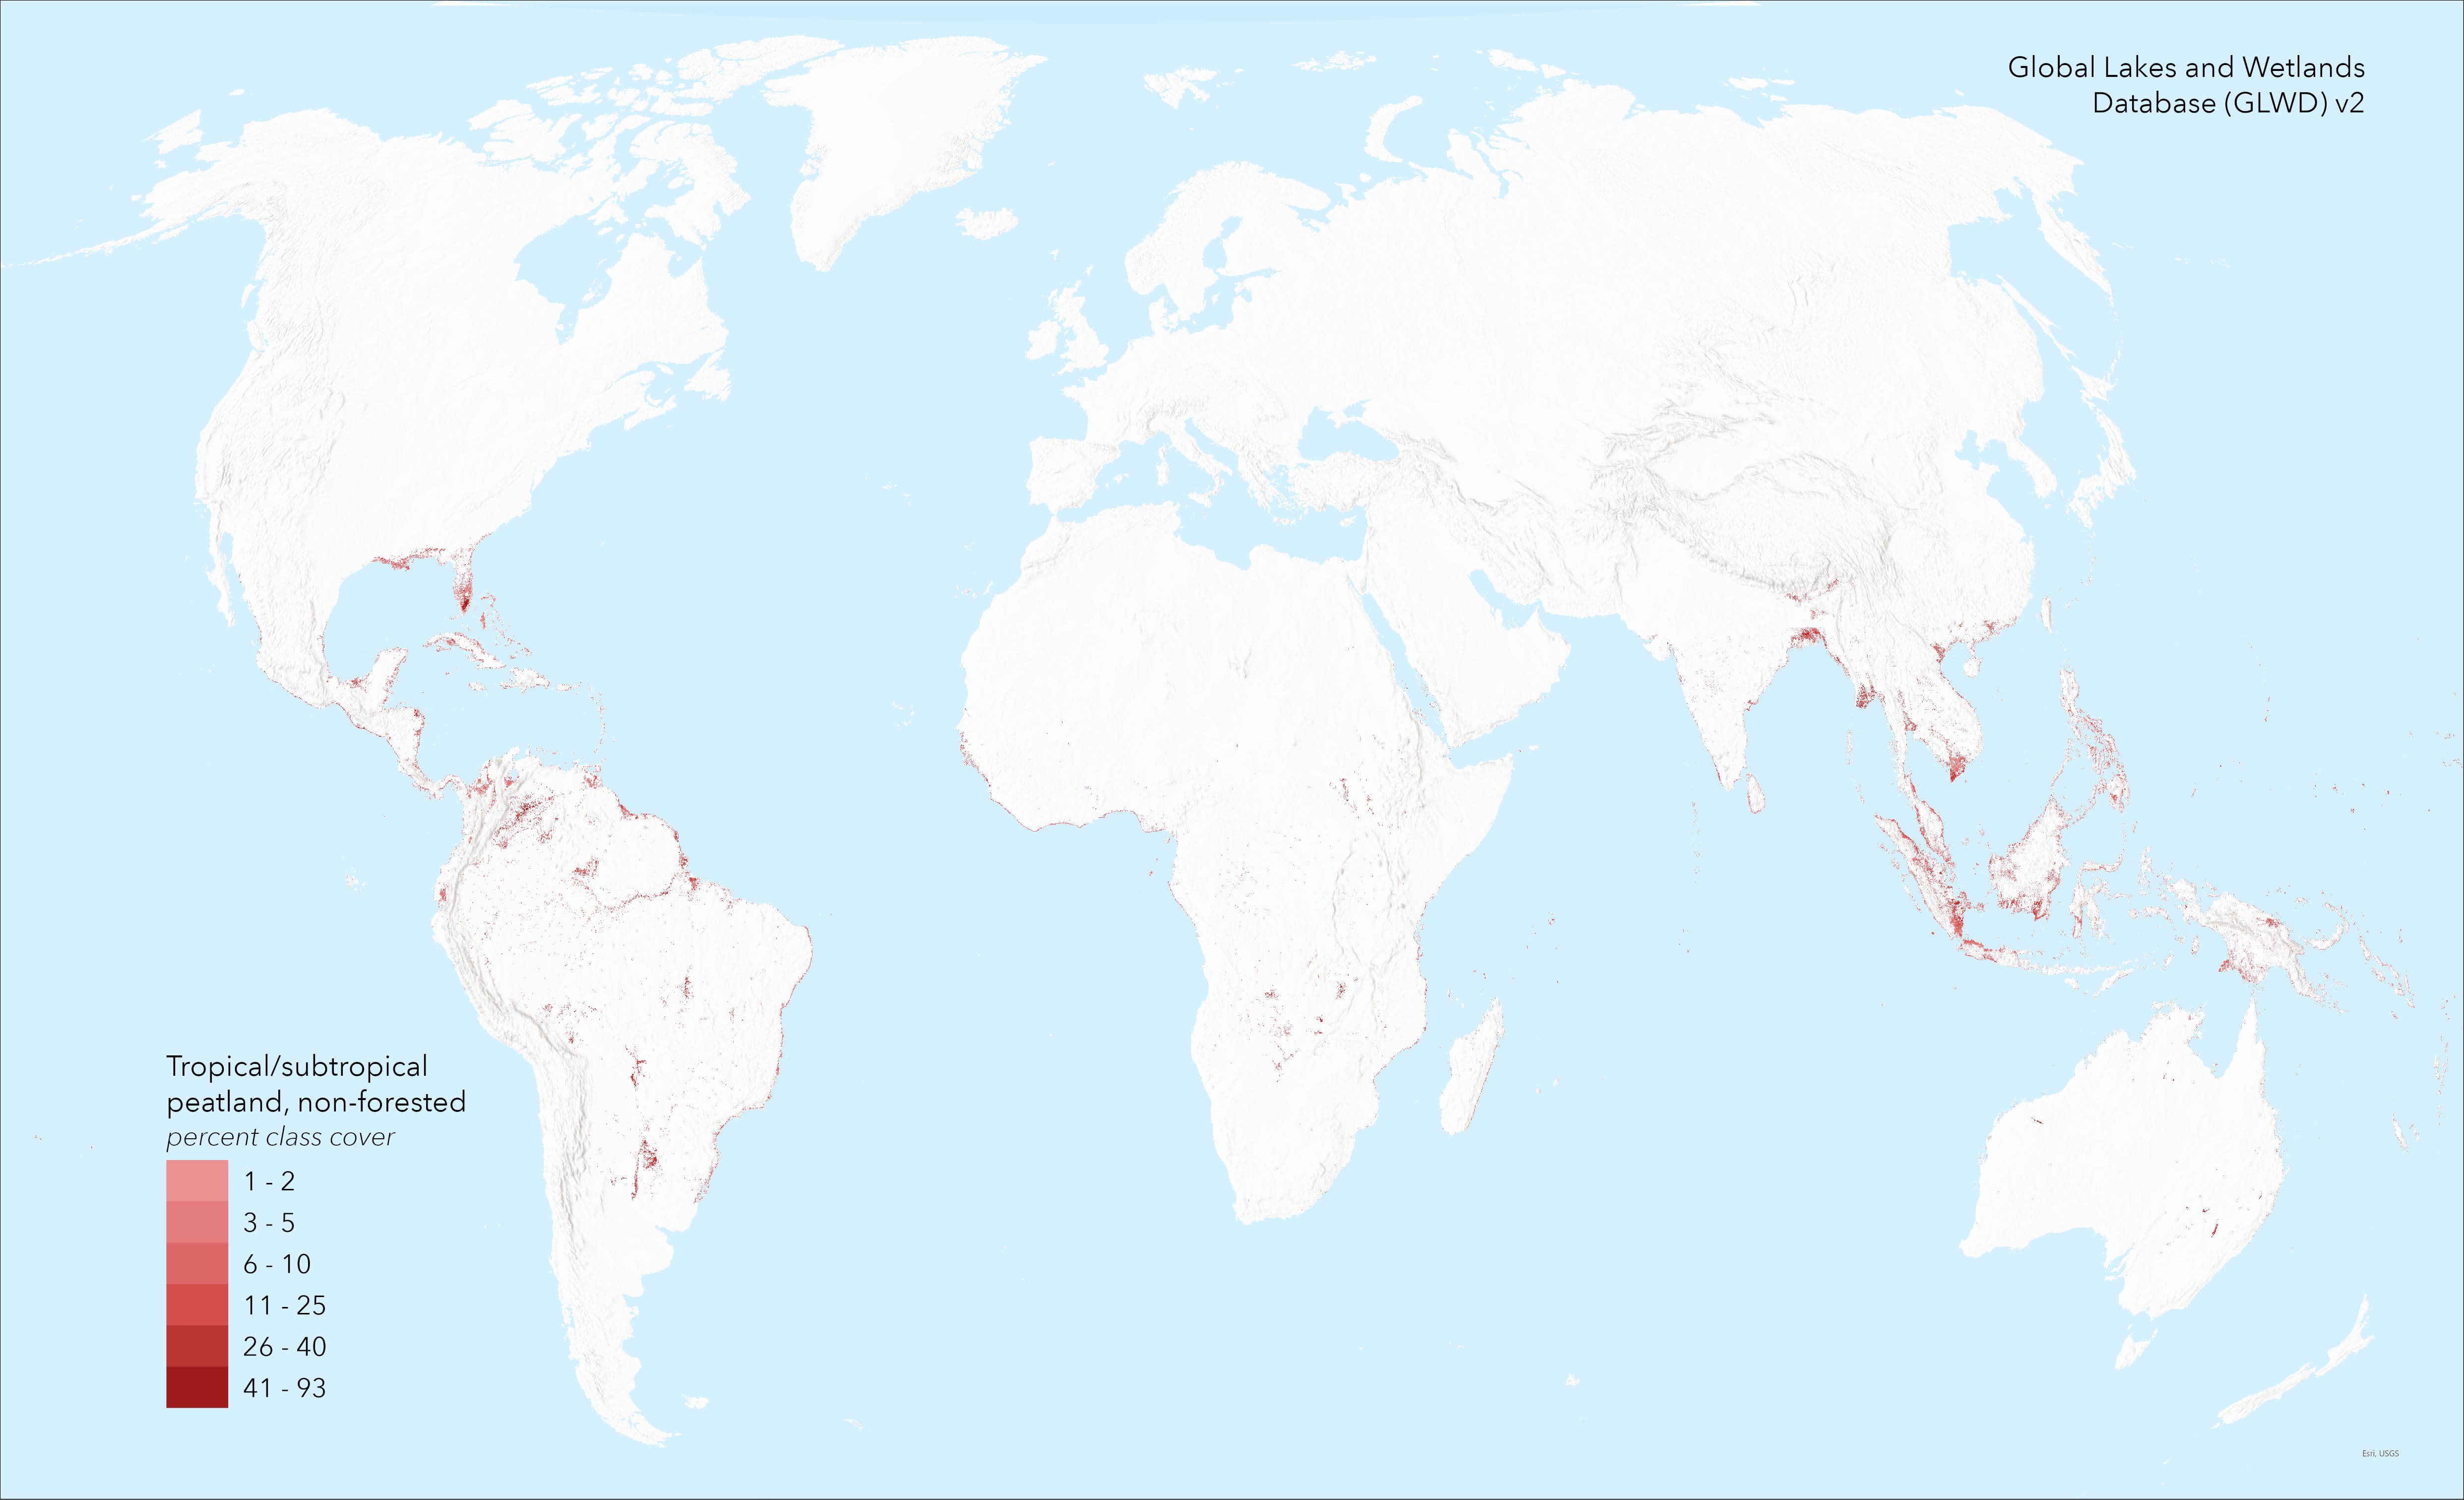
Peatland distribution
GLWD v2 maps global peatlands by combining several complementary source datasets, enhanced by filling and filtering of some artifacts and gaps. The result was then stratified by climate zone (arctic/boreal, temperate, tropical/subtropical) and further divided into forested and non-forested classes using satellite-based forest cover data. Peatlands are predominantly concentrated in northern latitudes above 45°N, especially across boreal and subarctic zones in Canada, Russia, and parts of northern Europe. Significant peatland extents also exist in tropical and subtropical regions, particularly in Southeast Asia and parts of South America and Africa. This distribution reflects strong climate and geomorphic controls, with peatlands favoring cool, wet climates in the north and waterlogged lowland basins in the tropics.

Total peatland extent mapped in GLWD v2, combining all six peatland classes (arctic/boreal, temperate, and tropical/subtropical; forested and non-forested). Values represent percent coverage per 500 m grid cell, ranging from 1% to 100%. Cells with 0% are classified as non-peatland.